Senior housing is a worldwide crisis, especially in Hartford. To understand the big picture we have to understand the little details as well. Underneath is a map of Hartford and all of its neighborhoods. The Liberal Arts Action Lab focused on neighborhoods: Barry Square, Behind the Rocks, and the South End.
To better understand the dynamics of the Barry Square and South End neighborhoods (Census Tracts 5001, 5002, 5023, 5024, 5026, and 5027), we analyzed key demographic and economic indicators, including gender distribution, median household income, and poverty among seniors.
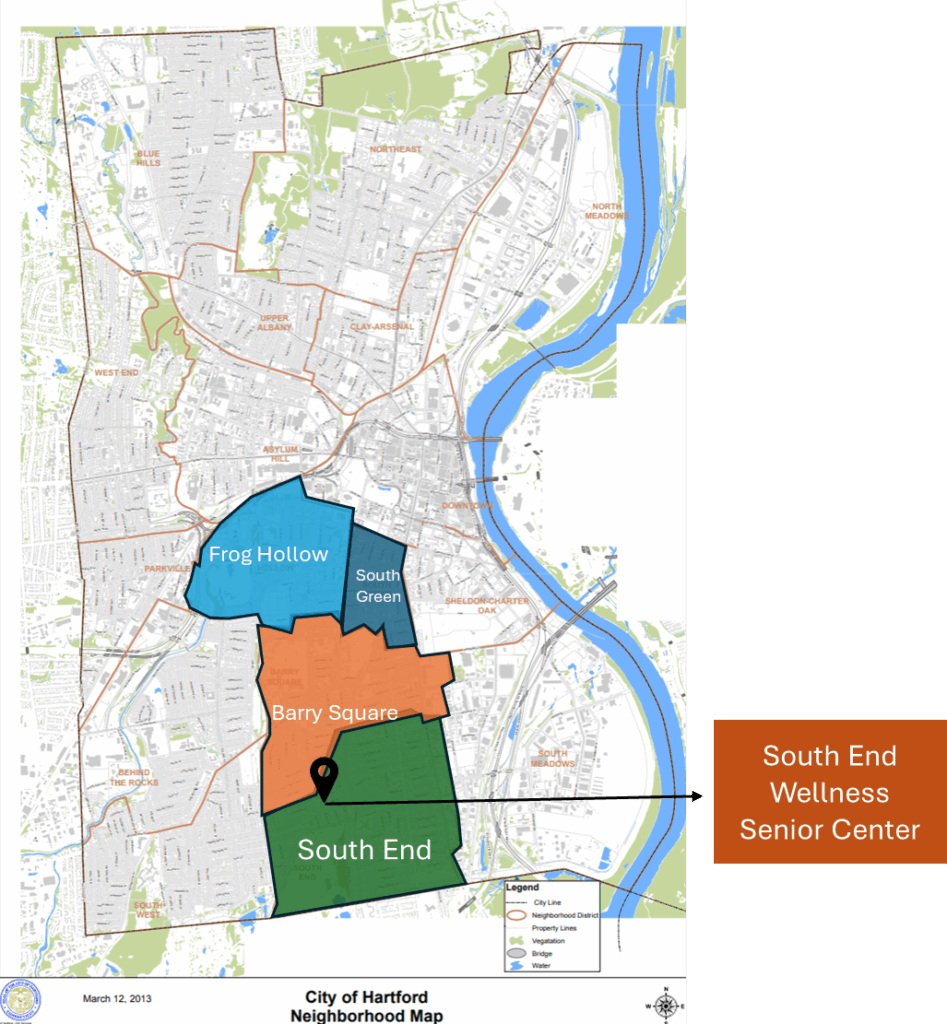
Source: Adapted from the City of Hartford Neighborhoods Map
Concentration of Seniors (Age 55+) in Hartford Neighborhoods
This choropleth map illustrates the distribution of the senior population (age 55 and older) across neighborhoods in the Hartford region as of 2023. Darker shades represent areas with a higher concentration of older adults, while lighter shades indicate lower concentrations.
The map shows that the South End and Behind the Rocks neighborhoods have some of the highest concentrations of seniors. In certain census tracts within the South End and Barry Square, nearly 40% of the population is aged 55 or older. These findings highlight the need to prioritize these neighborhoods for senior-focused housing, services, and community development initiatives.
Gender:
The total population across these tracts is 25,311 residents. Gender distribution is fairly balanced, with 47% male and 53% female residents overall.
Table 1: Gender

Source: U.S. Census Bureau (2023). American Community Survey (ACS) 5‑year estimates.
Median Household Income:
Median household incomes vary significantly across the neighborhoods. While the citywide median household income in Hartford is $45,300, the neighborhoods show a wide range—from $34,171 in Tract 5027 to $61,917 in Tract 5026. The overall average across these neighborhoods is approximately $47,471, slightly above Hartford’s citywide median.
Table 2: Median Household Income (In 2023 Inflation Adjusted Dollars)

Source: U.S. Census Bureau (2023). American Community Survey (ACS) 5‑year estimates.
Poverty Among Seniors (Age 65+):
Of the 2,139 seniors for whom poverty status is determined in these neighborhoods, 25.7% are living in poverty. This is comparable to Hartford’s citywide senior poverty rate of 26.5%. However, there are significant disparities between tracts: for example, In Census Tract 5027, more than half of seniors (56%) live in poverty, while in nearby Tract 5026, only 12.4% of seniors are affected.
Table 3: Population Age 65 and Over for Whom Poverty Status Is Determined

Source: U.S. Census Bureau (2023). American Community Survey (ACS) 5‑year estimates
After Thoughts
Affordability for senior housing within the US is in a crisis, with seniors being strained by ever-increasing overbearing costs year by year. Hartford especially struggles with housing for seniors, nonetheless affordable housing. However, taking into account Hartford’s diverse population the problem only grows. The Hispanic and Black communities particularly have been at a disadvantage time and time again, and as the community grows older, the obstacles only increase. Affordable senior housing is important, but affordable senior housing for all, should be indisputable.