Using an Online Qualtrics Survey, our team was able to gather data from 59 Hartford families (120 Children). The online survey was posted on Active city’s website, so many of the respondents were already involved in sports. Keeping this in mind we analyzed this data separately from the in-person surveys we collected. This Data has allowed our team to understand the currents state of youth sports programming in Hartford as well as analyze our research questions:
-
At what rates do children in Hartford play sports?
-
What are potential barriers which prevent children from participating in youth sports?
-
Do parents of children who do not participate in a youth sports program wish that they would participate?
-
What sports are children in Hartford playing?
-
Do children participate in youth sports at the same rate by gender?
-
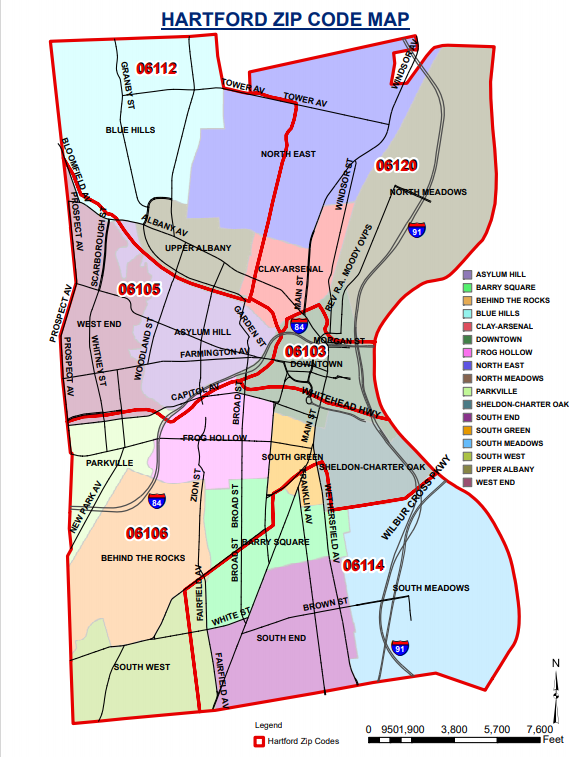
Do Hartford children participate in sports at the same rates by neighborhood and zip code?
-
Why does your child participate in sports?
-
How did you hear about your child’s Sports Program?
-
Do families of varying income levels enroll their children in youth sports programs at the same rate?
-
Do parents with varying levels of education enroll their children in youth sports programs at the same rate?
Current State of Youth Sports in Hartford
1) Are children in Hartford between the ages of 5-14 playing sports?
> A high percentage of online surveys reported their children played sports.
According to the latest Census, about 25,000 (20%) of Hartford consists of children under the age of 15.
2) What are potential barriers which prevent children from participating in youth sports?
>Cost of Sports Programs were the most common barrier for online respondents.
*Lack of Transportation, Health/Injury Concerns, and Language were not included as options on the Qualtrics survey.
3) Do parents of children who do not participate in a youth sports program wish that they would participate?
>Parents of children who are not currently playing sports want their children to participate.
4) What sports are children in Hartford playing?
>Soccer and Basketball are the most popular sports amongst online survey respondents.
5) Are children participating in youth sports at the same rate by gender?
>Amongst online respondents, girls are participating at a slightly lower rate.
6) Do Hartford children participate in sports at the same rates by neighborhood and zip code?
>Although most respondents had children that participated in sports programming, children from the North End (06112) and Barry Square (06106) were more likely to not play sports.

7) Why does your child participate in sports?
> Children participate in sports to exercise and for their own enjoyment.
8) How did you hear about your child’s Sports Program?
> Online survey respondents reported Friends/Family as the most common response with School and Social Media both being common as well.
Organizations should utilize partnerships with schools as well as social media to increase participation rates.
9) Do families of varying income levels enroll their children in youth sports programs at the same rate?
>Children from poor families are less likely to be enrolled in a youth sports program.
Approximately 42% of households in Hartford earn an annual income below $25,000.
10) Do parents with varying levels of education enroll their children in youth sports programs at the same rate?
>Children from families with lower levels of completed education are less likely to be enrolled in a youth sports program.
Approximately 83% of Hartford residents aged 25 or older are not college graduates.
