Employment/Unemployment Figures
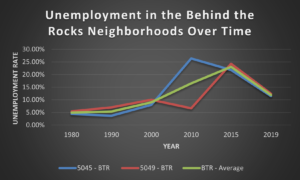
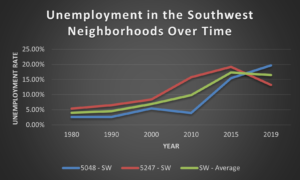
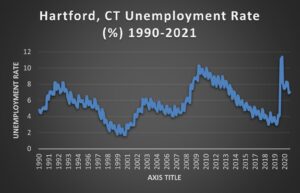
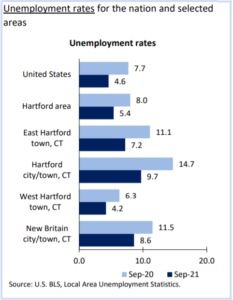
The figures below give a snapshot of employment and unemployment in the Behind the Rocks and Southwest neighborhoods over the past four decades. Also included are current figures from Hartford and surrounding areas.
Employment by Industry
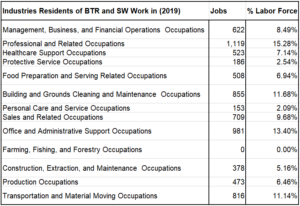
The breakdown of occupations by industry in the Behind the Rocks and Southwest neighborhoods over time is interesting to look at and compare to Hartford and the nation as a whole. In general it seems that the sectors in which residents work has not changed much over the past 40 years. There was a major shift in the labor market over this time away from manufacturing. In 1980, approximately 25.7% of residents in these neighborhoods worked in manufacturing. In 2019, this number had reduced to 6.5% working in production occupations. A large amount of jobs shifted into other sectors such as administrative, health and personal care, maintenance, and transportation.
The links below show the breakdown of occupation by industry in the two neighborhoods over time.