
Median income over time
The median household income in Hartford in 2019 was $36,278, which is significantly lower compared to the state of Connecuticut’s median income that same year at $78,833.
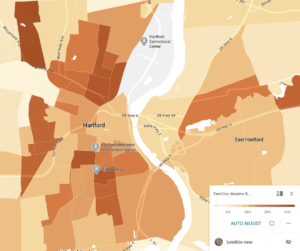
Job growth rate
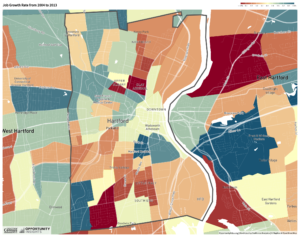
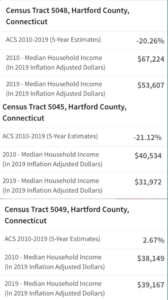
Behind the Rocks experienced little change in job growth rate from 2004-2013 showing a -0.9 percent and 0.7 percent changes in census tracts 09003504900 and 09003504500 respectively. This is depicted in the light yellow and light orange sections next to the dark blue of Southwest.
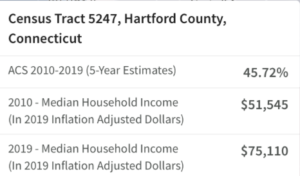
From 2004-2013, Southwest tract 09003524700 experienced some of the highest job growth rates in the city (outlined in gray). The neighborhood saw a 13 percent increase in that decade, shown in dark blue.
Poverty rate
The percent of persons in poverty in the city is 30.3. The poverty rate in Hartford is dramatically higher compared to the rest of the state’s 10.1 percent (2021 Welfare Info.org).
Poverty rate by census tract/neighborhood
- Tract 5048 (Southwest)- 17.27%
- Tract 5247 (Southwest)- 7.31%
- Tract 5049 (Behind the Rocks)- 14.46%
- Tract 5045- (Behind the Rocks)- 23.91%
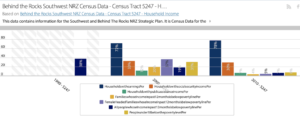
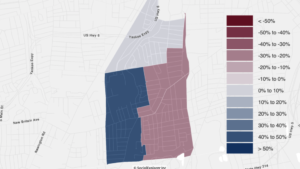
Depicted in dark blue, peoples with income below the poverty line has dramatically decreased from 1990-2010 in the neighborhoods. Overall trend in the neighborhoods since the 1990s is an increase in wealth.