Because our group is interested in immigration, one of the first questions we asked ourselves was: who is coming to Hartford? Using SocialExplorer, a website that uses information from the American Community Survey, we found out what communities are coming to the city.
Most people arrive to Hartford from Latin America, as more than 73% of the new arrivals that came to Hartford in 2016 were Latin American.
| Region of Origin | Number | Percent |
|---|---|---|
| Latin America | 19,350 | 73.4% |
| Asia | 3,181 | 12.1% |
| Europe | 2,897 | 11.0% |
| Africa | 932 | 3.5% |
| Total Foreign Born | 26,382 | 100.0% |
There is a very strong presence of a Caribbean culture in the city, which has increased in importance since 2010.
| 2016 | 2010 | ||||
|---|---|---|---|---|---|
| Countries of Origin | Number | Percent of Foreign born | Number | Percent of Foreign born | |
| Barbados | 159 | 0.60% | 183 | 0.70% | |
| Trinidad & Tobago | 269 | 1.00% | 296 | 1.10% | |
| Cuba | 351 | 1.30% | 145 | 1% | |
| Haiti | 487 | 1.90% | 288 | 1.10% | |
| Other Caribbean | 1,221 | 4.60% | 637 | 2.40% | |
| Dominican Republic | 1,939 | 7.40% | 1,605 | 6.00% | |
| Jamaica | 7,596 | 28.80% | 7,774 | 29% | |
| Caribbean | 12,022 | 45.60% | 10,928 | 41% | |
number of foreign-born people from this region increased from 10,928 in 2010 to 12,022 in 2016. Specifically, there is also a rising Dominican Republic population 1,605 in 2010 to 1,939 in 2016.
While the greatest number of Hartford’s foreign-born population is from Latin America, there has been a slight decrease of 1,120 people since 2010.
The Hartford Public Library told our group that there is a large Spanish speaking community- which was apparent by the large Hispanic/Latinx population we found when looking at the population- and an emerging African-French speaking group that comes to their class regularly. To see if this was true for all of Hartford, our group went back to SocialExplorer to look at languages spoken in the city.
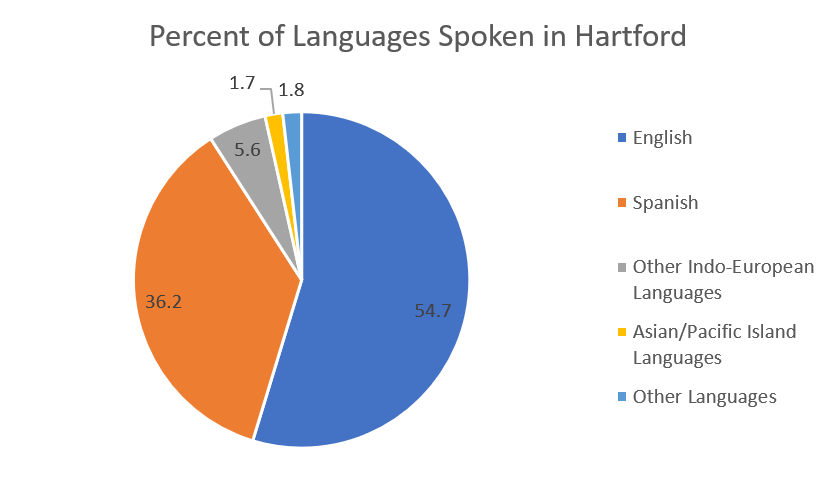
As we predicted, there was a huge Spanish speaking population in the city, but unexpectedly there was little French spoken in Hartford. We accredited this discrepancy to a larger portion of the African-French communities taking advantage of the library’s program.
Our team was able to complete five out of nineteen interviews in Spanish. This made our study much more diverse and gave us new insight into communities we wouldn’t have been able to reach otherwise.
We have included an interactive map below. This map shows the Hispanic and Latinx population in Hartford and surrounding areas. The darker the orange the larger the Hispanic community.