
We had a total of 239 respondents to our survey, with 117 filling it out 100%. 204 filled out the survey to 98% (Clicking the link to continue to the petition results in 98% completion). 146 respondents said that they were from the suburbs. It’s difficult to target specific populations with a Facebook post, so we were pleased that over 70% of the respondents were from the areas with which we were most concerned.
We broke down are finding into five categories: ideology, age, income, gender, and race. This enabled us to tailor our action steps to high key groups to target to better inform residents about PILOT and to garner more support.
Ideology
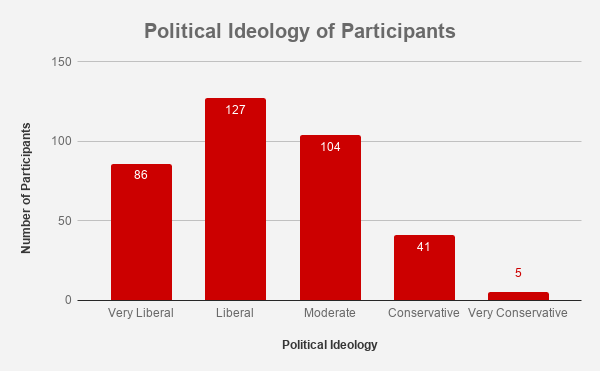
We found from our survey data that having a liberal or more progressive political ideology would increase the likelihood that you were more likely to support PILOT.
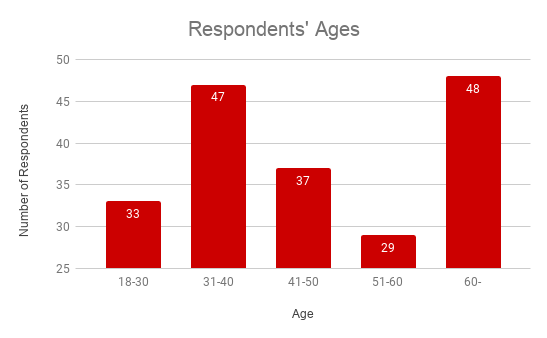
Age
In addition, the median age of the respondents to the survey was 47.5. This age median is based on a total of 194 out of 239, or 81% of the respondents who provided their age in the survey. Our chart below shows the relation of age to the number of respondents that took the survey.
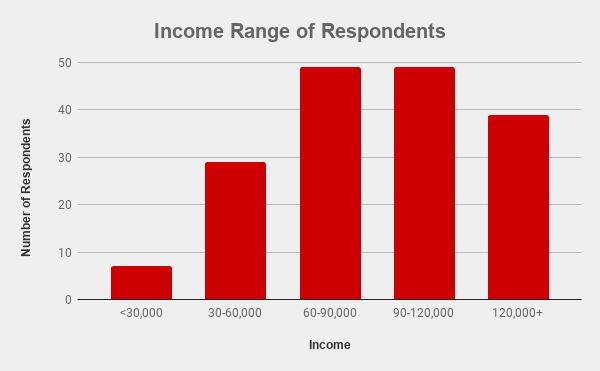
Income
The designed a graph to show the relationship between income and the number of respondents who the income portion of our survey.
Suburban residents their gender & race
72 of respondents were male, 124 were female, 1 chose other, and 4 people chose not to respond. The overwhelming majority (171) of respondents were white, 6 responded with “Black or African American,” 6 chose “Hispanic or Latino,” 5 responded with “Asian or Pacific Islander,” 4 chose other, and 4 chose multiracial.