
Census Demographics
How Many Opportunity Youth Live in Hartford?
By looking at the American Community Survey (ACS) census data from 2012-2016 we found that 5566 Opportunity Youth currently live in Hartford. This varies from the previously recorded number of Opportunity Youth in Hartford in recent years. Below is a visual representation of these changes.
Program specific Demographics
What are the Racial and Ethnic Breakdown of Opportunity Youth in Hartford?
We were able to analyze demographic data given to us by our community partner in collaboration with the Hartford Opportunity Youth Collaborative (HOYC), we found that the Black/African American community was disproportionately represented as majority of Opportunity Youth were Black/African American. This was unexpected since there are more people of Hispanic/Latinx heritage than there are of Black/African-American heritage living in Hartford. Below is a table showing the Racial/Ethnic breakdown of program participants.
| Race/Ethnicity | 2016 | 2018 |
| Black or African American | 67.7% | 70.2% |
| Hispanic / Latinx | 34% | 36.6% |
| Non-Hispanic White | ** | 2.6% |
| Other | ** | 8.3% |
* This chart does not add up to 100% due to the overlap of categories
** These fields were not calculated/available for analysis
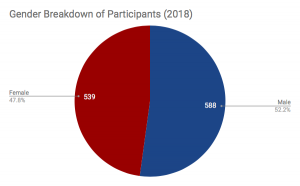
What is the Gender Breakdown of Opportunity Youth in Hartford?
The gender breakdown of the Opportunity youth living in Hartford can be seen below. We have observed a slight decrease in the male population being served by programs, however, the numbers have overall remained steady with no drastic changes. This contrasts the information found in readings and prior research. As reported by the Opportunity Road Report 1 “according to a comprehensive review by the Congressional Research Service (crs) of nine independent studies conducted from 1999 through 2007 and crs’s own analysis of current population survey (cps) data, more female and minority youth are disconnected. the rates of disconnection have also remained stable from 1988 to 2008 with disconnection rates for females consistently higher than for males and for minorities than non-minorities.”
What is the Age Breakdown of Opportunity Youth in Hartford?
We found the median age of Opportunity Youth to be 20 years old. Not only was this age the median, but it was the most represented age group by program participants, with 195 youth served being of this age.
The chart to the right aides in showing the difficulty in defining Opportunity Youth. CWP, as well as ourselves have defined Op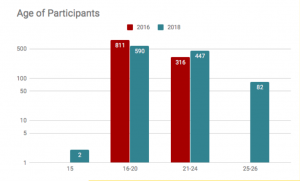 portunity Youth to be within the age range 16-24, however, there exists a few outliers. This may be because participants entered programs and services a bit earlier with their age being taken into special consideration, or perhaps those over 24 years old have stayed with the programs and services longer than the 16-24 range and are on track for completion. We noticed a fall in the number of youth between the ages of 16-20 and a rise in the youth in the range 21-24. This could be because the program participants from the prior years have aged out of their previous range, meaning the same program participants are being served, just in different capacities.