Most Opportunity Youth in the City Live in the South End, but Most Opportunity Youth Receiving Services Live in the North End
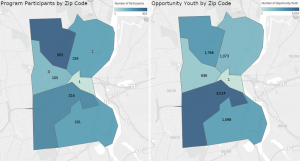
The map on the left shows the number of youth being served within each zip code in Hartford; the map on the right side shows the total number of Opportunity Youth in each zip code in Hartford.
We have observed a striking difference in these maps. There are almost twice as many Opportunity Youth in the South End when compared to the Blue Hills area, but there are 40% more program participants from Blue Hills than in the South End zip codes. According to our analysis, in the Blue Hills neighborhood, 17% of Opportunity Youth are receiving services. In the zip code that includes the SW, Frog Hollow, and Parkville, only 7% of these youth are receiving services.
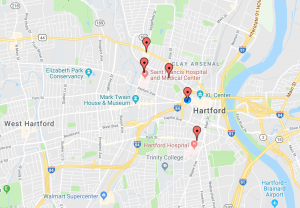
This could be due to a bevy of reasons. Firstly, we only have data from five organizations who are located in the locations below. If we got data from the remaining 10, our findings might change. This may also suggest that existing programs could target recruitment in the South End neighborhoods to serve more youth.
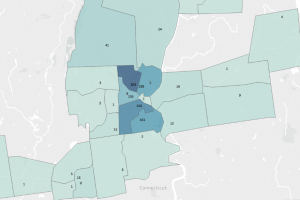
The map below shows the breakdown of the program participants by zip code. While most program participants come from Hartford, a substantial minority come from outside the city limits. One participant came from as far away as Massachusetts.