
Opportunity Youth Face Challenges At an Increasing Rate
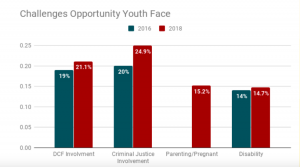
*Data on Parenting/Pregnant was not collected for the year 2016.
The above visualization shows the percentage of program participants that were involved in the foster care system, the criminal justice system, had a disability or were parenting or pregnant for the years 2016 and 2018. Compared with 2016, the current Criminal Justice Involvement has increased by 4.9 percentage points. While ‘DCF Involvement’ increased by 2.1% currently making it 21.1%.
When we investigated the number of barriers or challenges the youth faced, 187 participants faced 2 or more challenges, 16.6% of Opportunity Youth served.
| Number of barriers faced | Participants |
| 0 | 489 |
| 1 | 449 |
| 2 | 159 |
| 3 | 26 |
| 4 | 2 |
| Grand Total | 1125 |
The barriers in relation to the age of the participants showed a direct relationship between the age and the number of barriers faced. As the age increases so does the number of barrier. It seems that barriers are cumulative over the course of a lifespan.
The chart table below shows the number of unduplicated Opportunity Youth per age group who face at least 1 challenge. We found that on average 56.6% of Youth Being served faced at least a single challenge. It also gives evidence to older participants being more likely to experience more barriers.
| ClientID |
Number of barriers faced
|
|||||
| Age | 1 | 2 | 3 | 4 | Grand Total | Percentage of total in age group |
| 15 | 1 | 1 | 2 | 100.0 | ||
| 16 | 2 | 3 | 5 | 55.6 | ||
| 17 | 35 | 13 | 48 | 60.0 | ||
| 18 | 37 | 24 | 3 | 64 | 53.3 | |
| 19 | 77 | 21 | 6 | 104 | 58.8 | |
| 20 | 76 | 30 | 3 | 1 | 110 | 56.4 |
| 21 | 53 | 22 | 7 | 1 | 83 | 52.5 |
| 22 | 44 | 15 | 5 | 64 | 50.4 | |
| 23 | 40 | 9 | 1 | 50 | 54.3 | |
| 24 | 36 | 14 | 50 | 64.1 | ||
| 25 | 32 | 4 | 1 | 37 | 59.7 | |
| 26 | 12 | 3 | 15 | 71.4 | ||
| NULL | 2 | 2 | ||||
| Grand Total | 447 | 159 | 26 | 2 | 634 | 56.6 |
Understanding the challenges Opportunity Youth face will help the programs in their efforts to meet the needs of youth needs while assisting them in reaching their goals.