Overview
The questionnaire for the Inclusive Museum group was officially opened on 2022. 11.07. The questionnaire was mainly shared by Community Partner through emails to relevant youth organizations and partially disseminated through group members on their personal social media platforms. After two weeks of data collection, the questionnaire was officially closed on 11.19. We received a total of 1,042 responses, which were reduced to 183 after data cleaning shown in below data analysis.
As stated earlier, the purpose of this research is to find the factors that barrier youth in Hartford area attending Museums, specifically Connecticut Historical Society. To help our community partner better understand their potential audiences, the social media usage, reason for visiting, and factors that influence audiences visit are three main aspects to learn about potential obstacles. And the data analysis for prefered themes and activities will provide community partner with a better view of the interests of the audience regardless of race and education, and provide a more personalized experience in the future. And more result indicated in the data will be connected in the future recommendation section.
Key Findings:
According to our data …..
Our Respondents & Demography:
Most of respondents are residents live in Hartford city area and identified themself as white.
Social Media Usage:
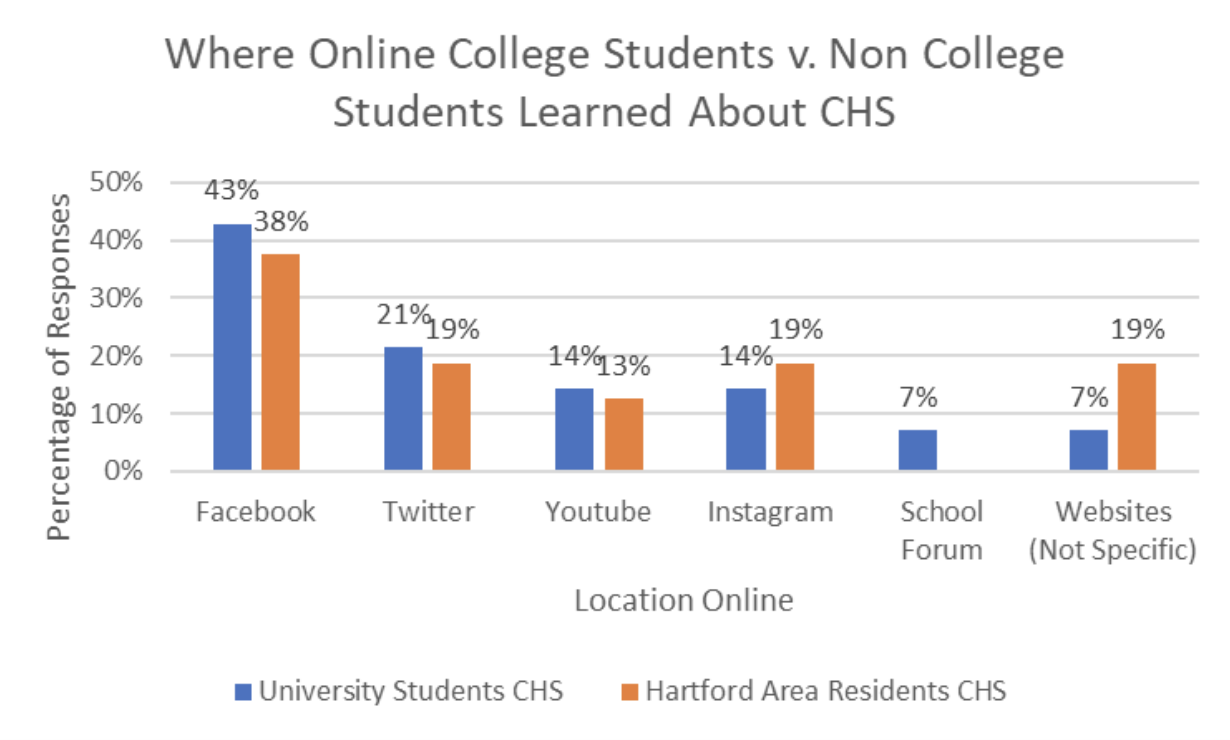
The majority of the audience learned about CHS through social media. And they generally tend to use Facebook to interact with cultural institutions.
Reason for Visiting:
Respondents prefer to visit the cultural institution due to their fun social/cultural activity.
Factors that Influence Their Visit:
Overall trend of considering availability of public transportation. Also, respondents with Associate or Bachelor degree has higher consideration of cite of the institution for their visiting.
Prefered Historical Themes:
Our Repondents show the interest in Revolutionary war as a history-related exhibition to visit. The data also showed that people were interested in Indigenous history, but that respondents of different ethnicities preferred to learn about their own cultural history. In other history theme choices, respondents preferred to learn about the historical and cultural background of the place they lived, as the story of Hartford’s history.
-
Our Respondents & Demographics from Data
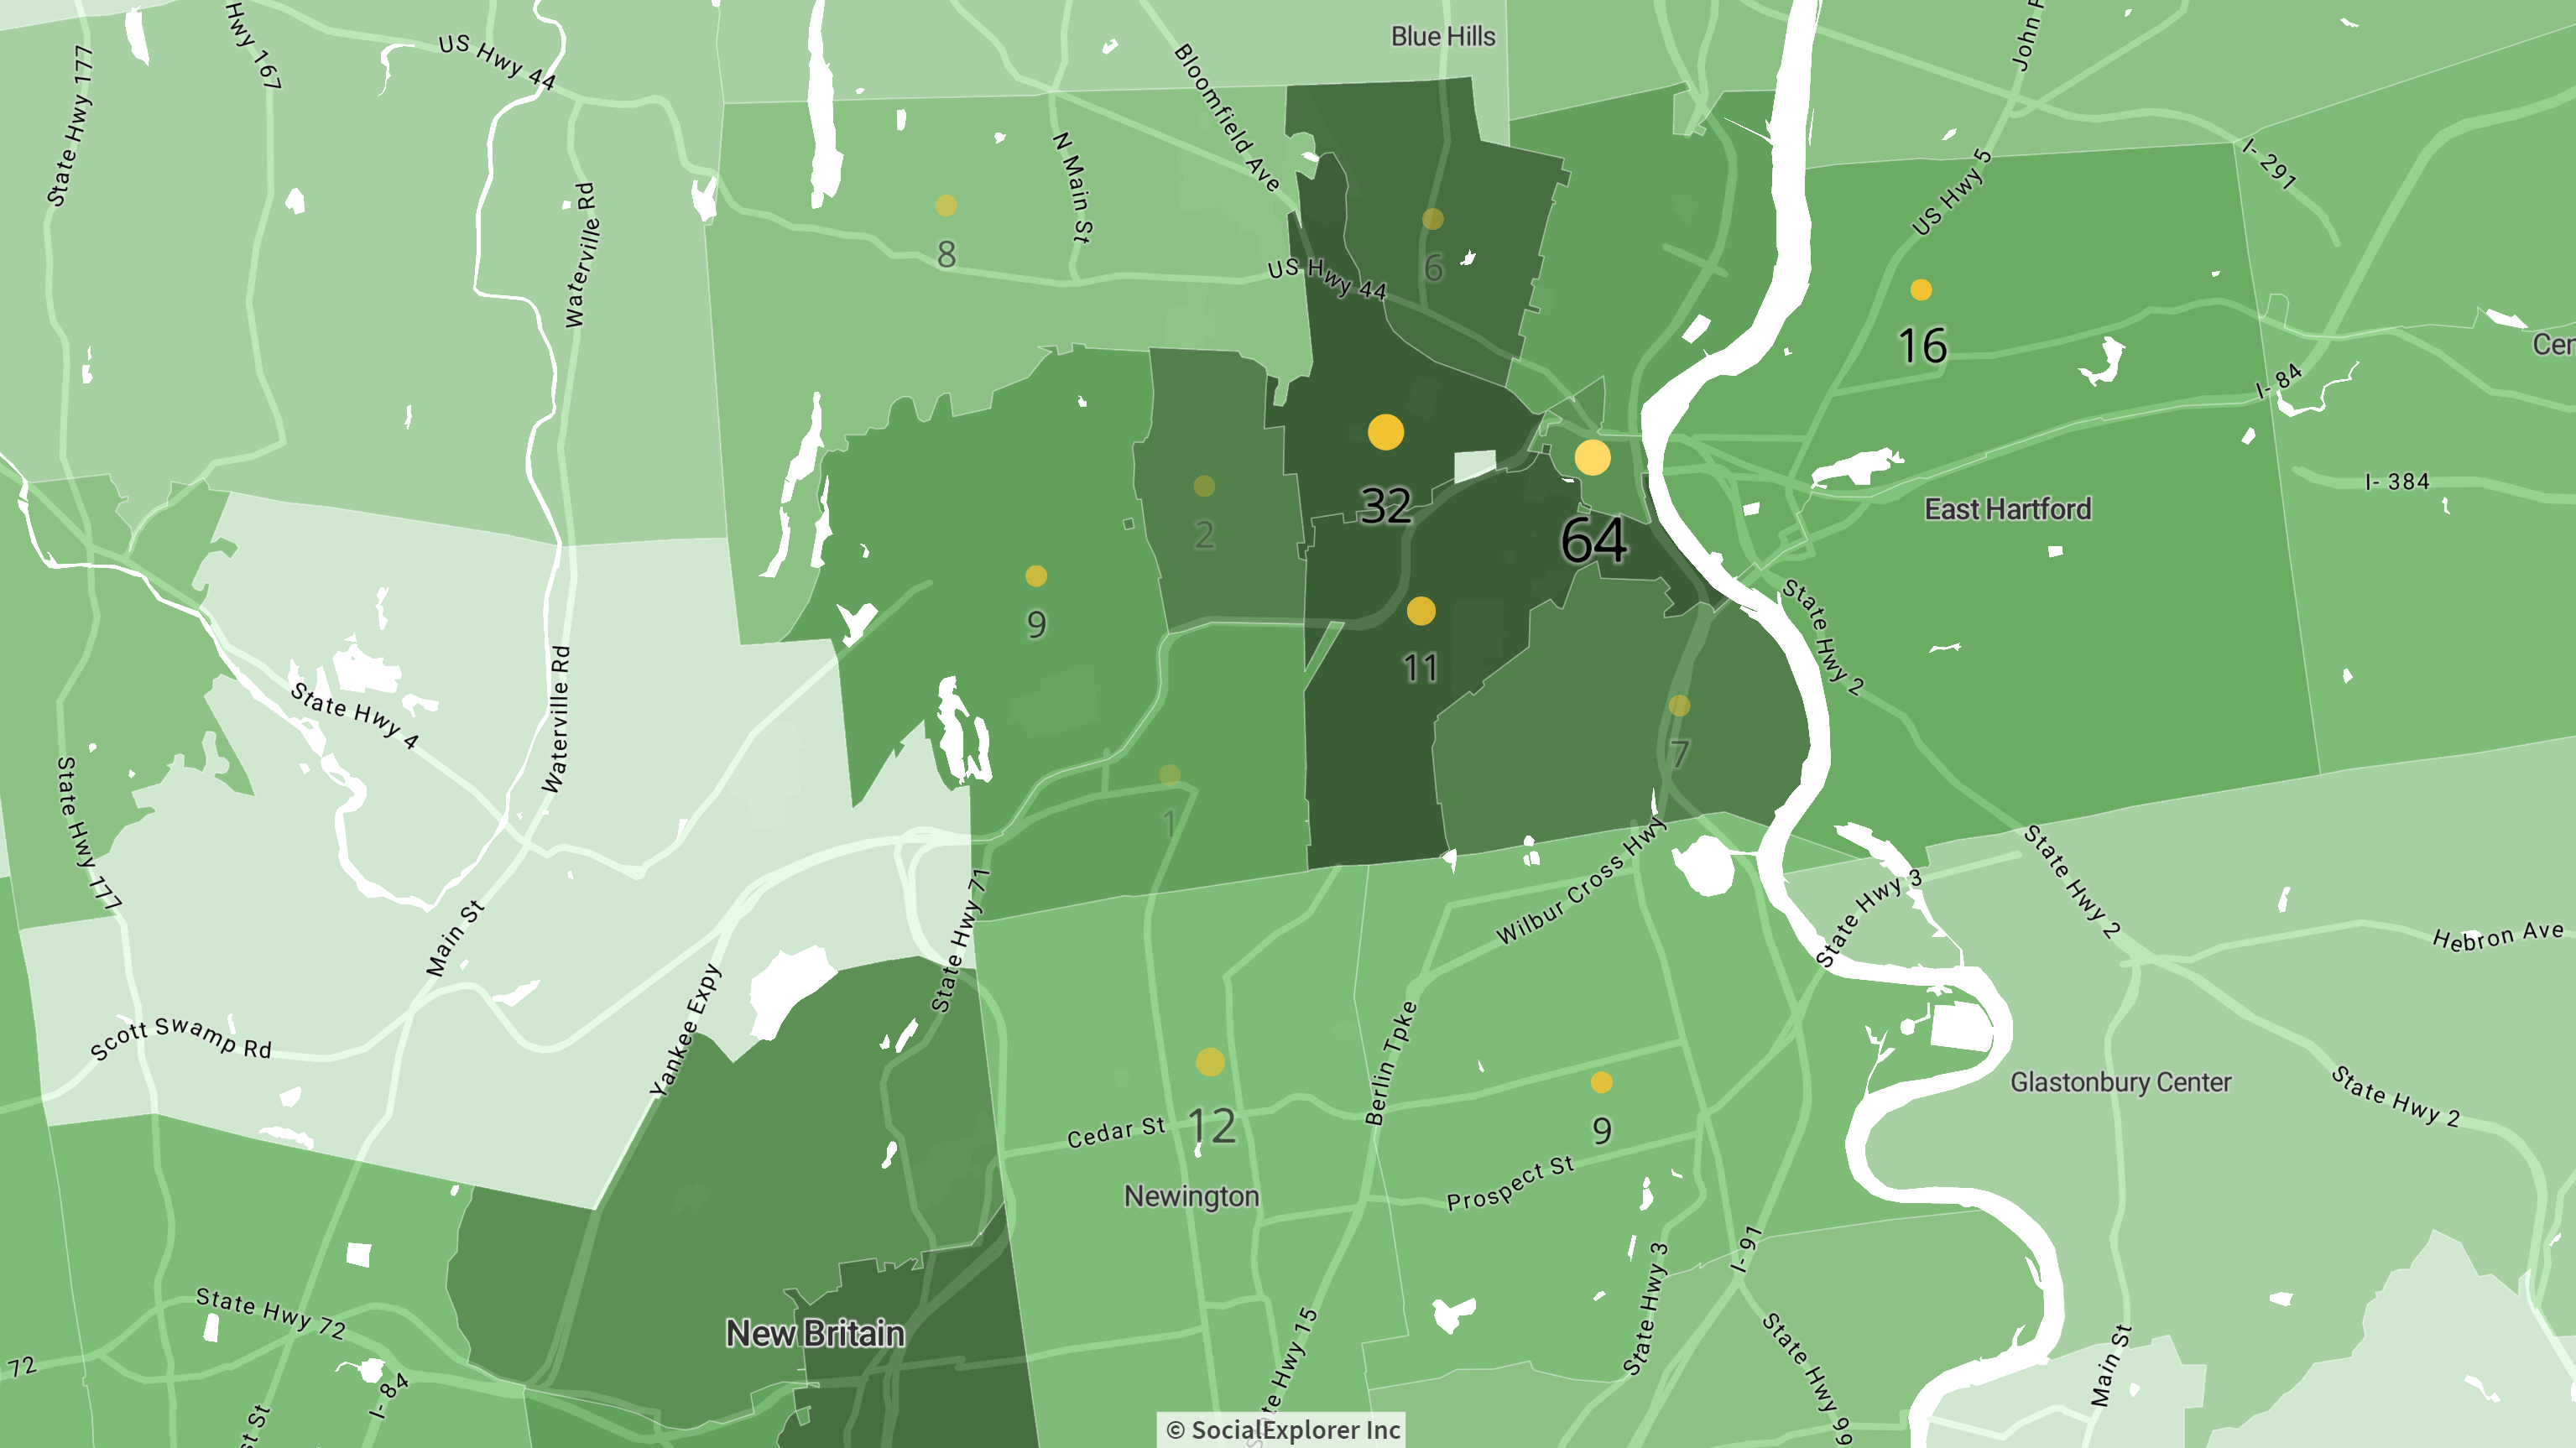
The project survey targets the Hartford surrounding areas with a maximum drive time of 15 mins toward Connecticut Historical Society. Based on the zip code information in our survey, the team composts an informational map that exhibited the concentration of our respondents in the Hartford surrounding areas. According to our data, most of respondents live in Hartford and West Hartford area.
- Target Area
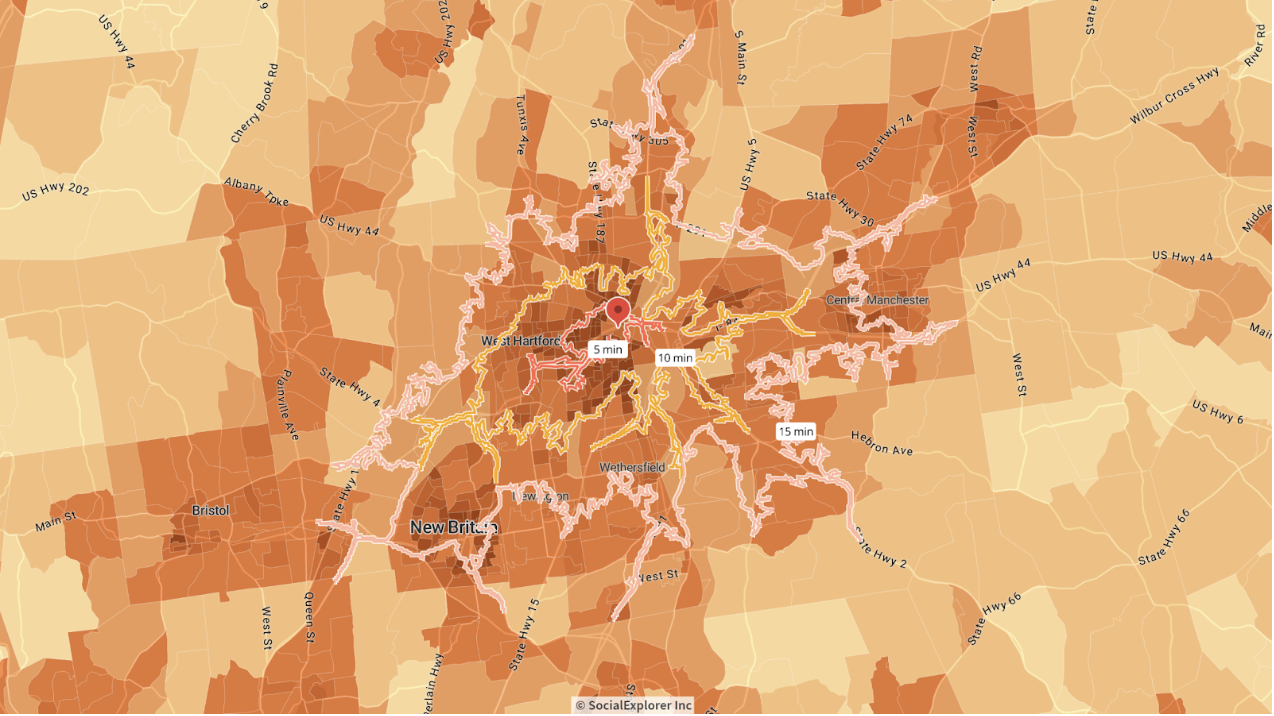
36% of the respondents were located in the downtown Hartford area (zip code 06103). At the same time, 67% of the respondents come from Hartford city.
- Distribution of Respondents in Target Area
Contrary to the responses of informal interviews, most of the survey respondents identified as white, the second highest group was Hispanic, Latino, or of Spanish origin, and the third highest group was Black or African American.
- Distribution of Education Attainment for our Respondents
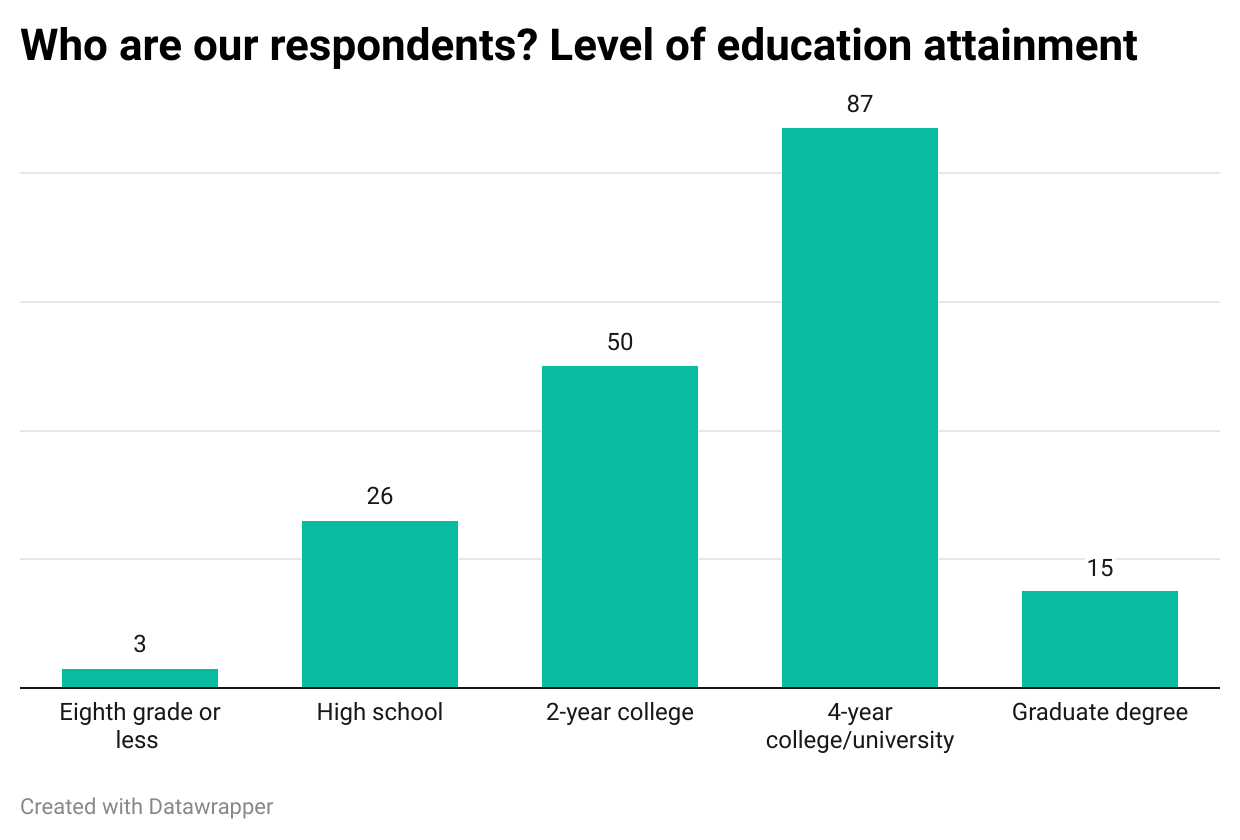
Indicated by data from survey, the majority of the respondents have a degree from 4-year college or university.
Differences between the interview data and survey data can be explained with the residency information from both. Most of the in-person interviewees were from the city of Hartford, whereas the survey showed more respondents from suburbs like West Hartford.
-
Social Media Usage
The discussion about the communication between social platforms and cultural institutions is developed in this section. In the questionnaire, relevant questions are asked around data on both social platforms for access to information and social interaction platforms.
- Audience of Connecticut Historical Society
The results indicated that both college students and non college students most frequently learned about CHS through Facebook.
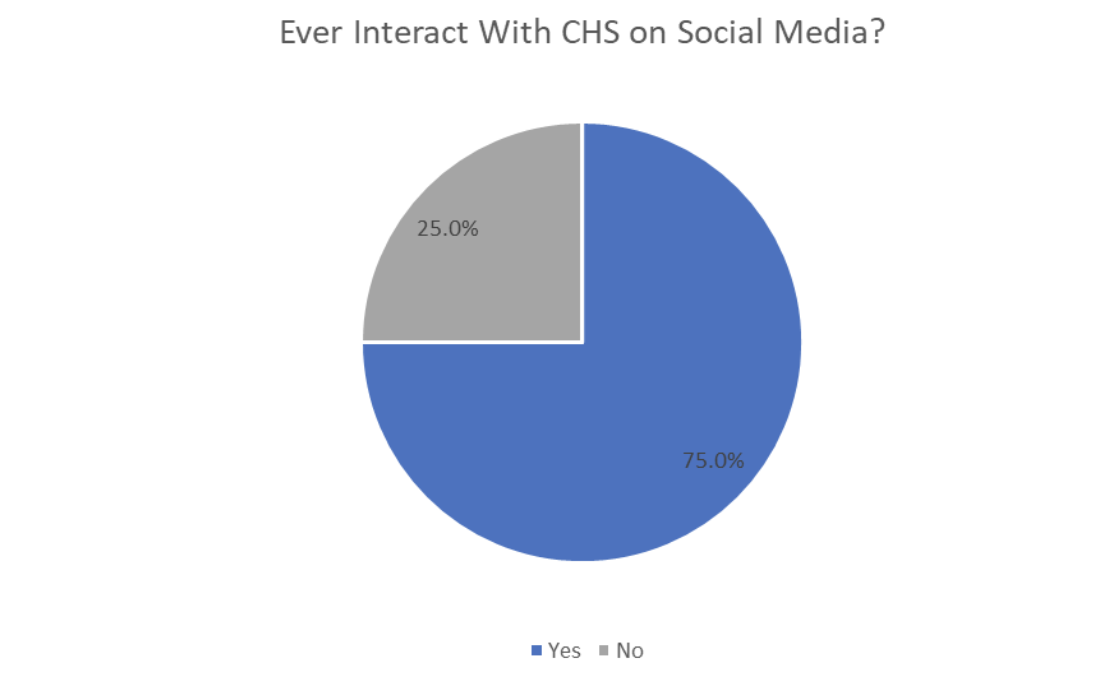
The survey indicates that a large majority of respondents have interacted with CHS on social media.
- Audience of other institutions in Hartford area
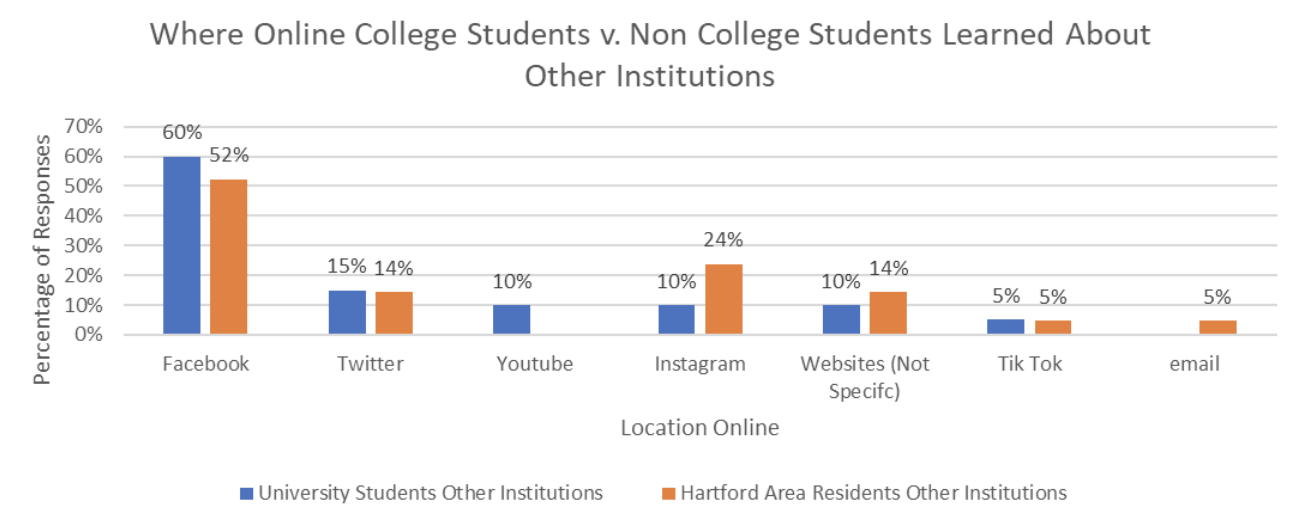
This group of sample shows that both college students and non college students most frequently learned about other institutions through Facebook.
- Social Connection and Interaction with Audiences
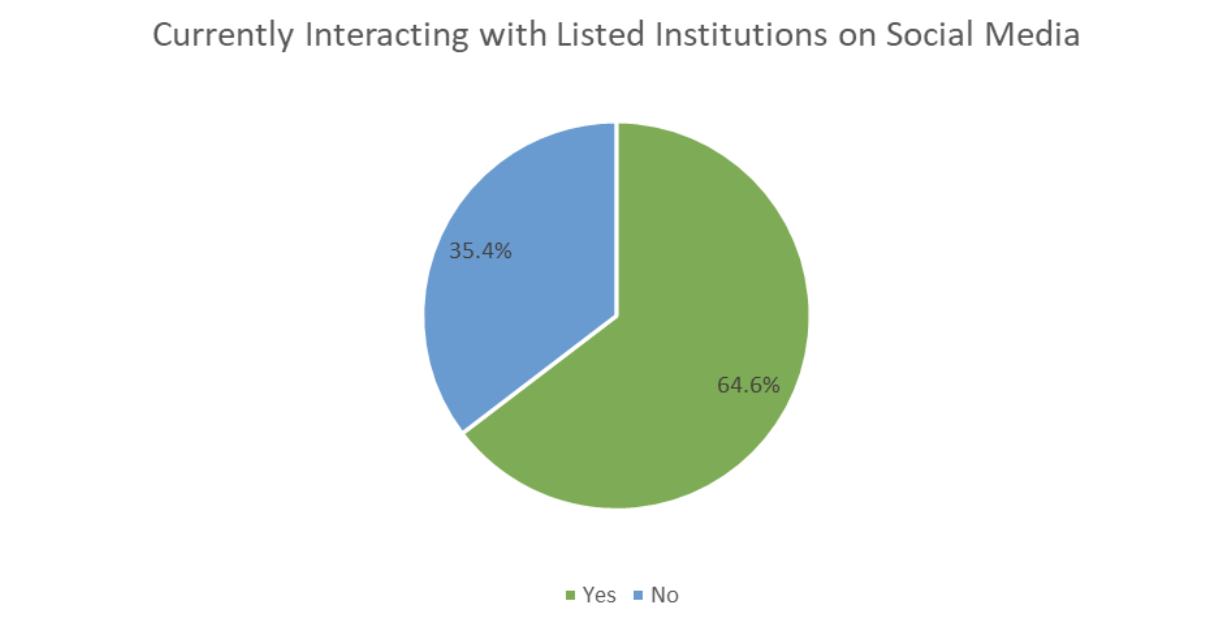
The survey shows that a strong majority of respondents currently interact with a nearby cultural public institution on social media.
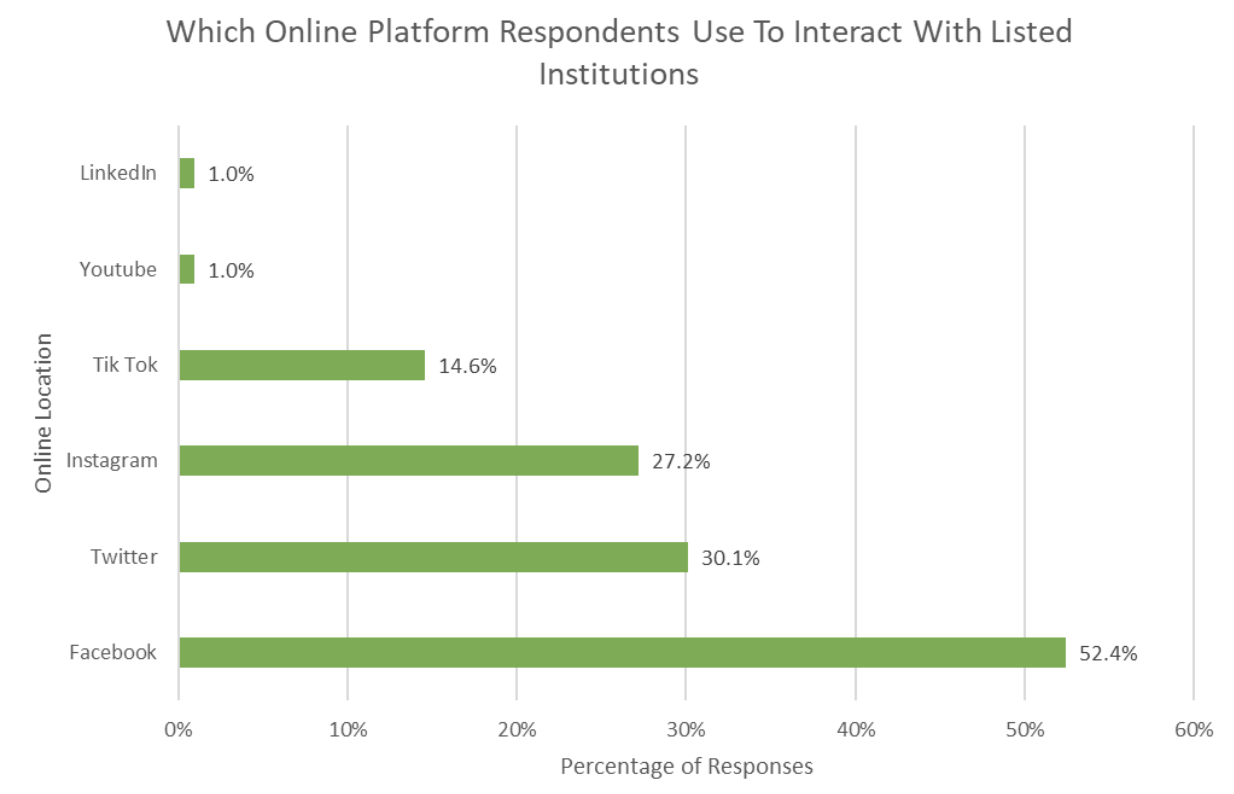
And according to the survey data, 52.4% of respondents choose Facebook to interact online with nearby public cultural institutions that were listed on the survey.
-
Reasons for Visiting
The purpose of the data analysis in this section is to identify the main reasons why visitors do not visit cultural institutions or museums. The data will be analyzed by two variables: education level and ethnicity, in order to better provide a personal customized experience for the audience.
Motivations of Attending Museums include: Learning about a Topic of Interest, Joining Family or Friends, Visiting with School Class, Conducting Research for a School Project, and Fun Social/ Cultural Event.
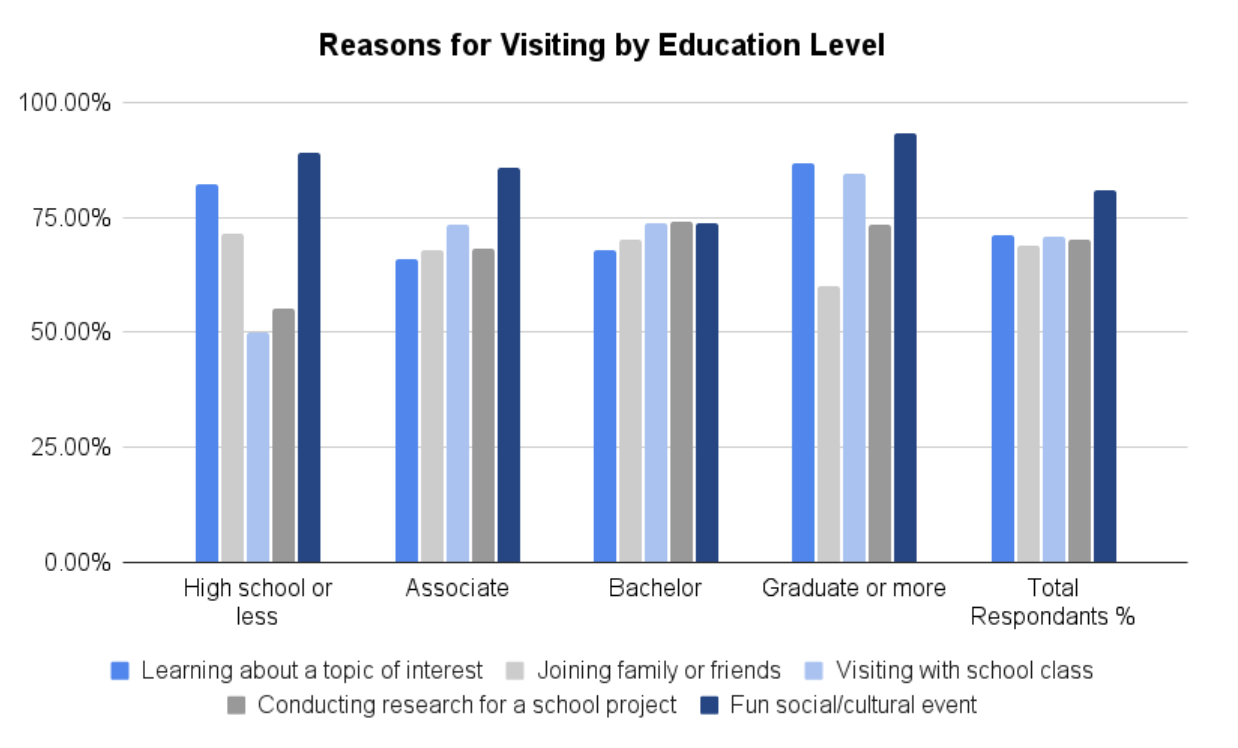
The results indicated that across different educational attainment, our respondents visit cultural institution as a fun social/cultural event the most frequently.
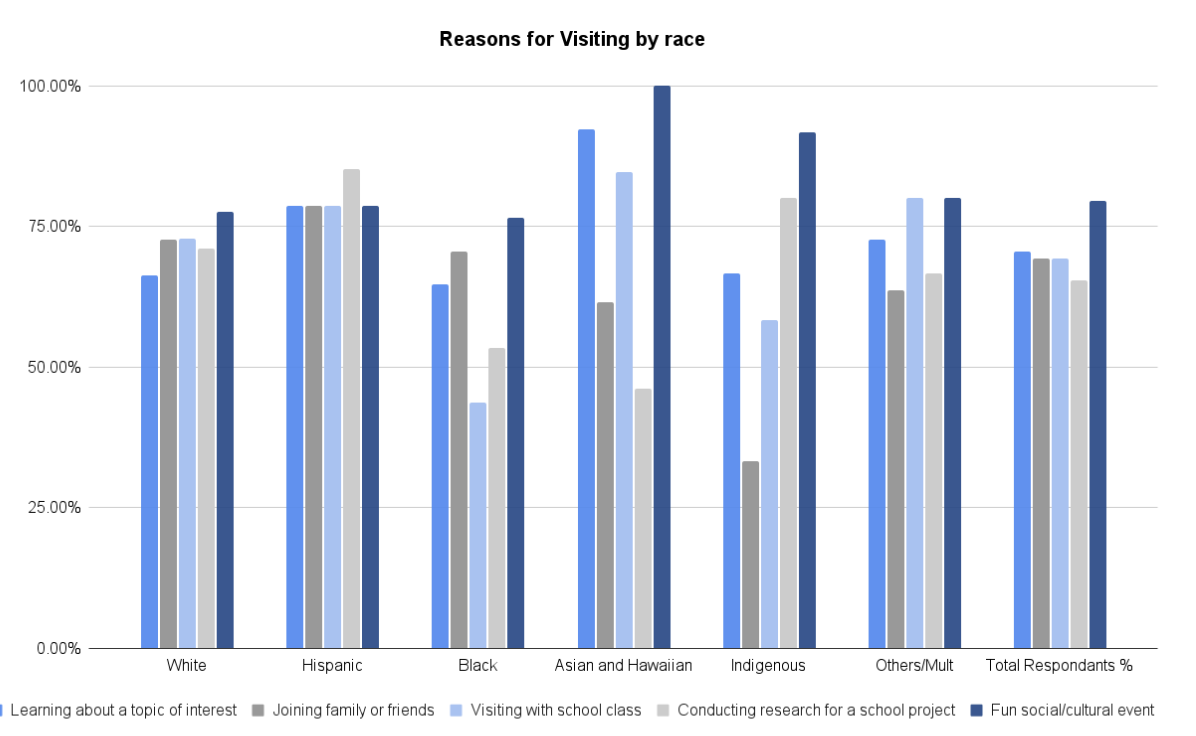
According to the survey data, our respondents from all racial/ethnic groups describe their reason for visiting the cultural institution as a fun social/cultural activity, except for the Hispanic.
-
Factors that Influence Their Visit
The data discussed in this section is to figure out the possible factors that might affect audiences’ willingness to attending the museums or cultural institution.
Reasons of Factors include: Cost and affordability, Location, Availability of public transportation, and Accessibility.
- Importance level of factors
– Factor as Race or Ethnicity :
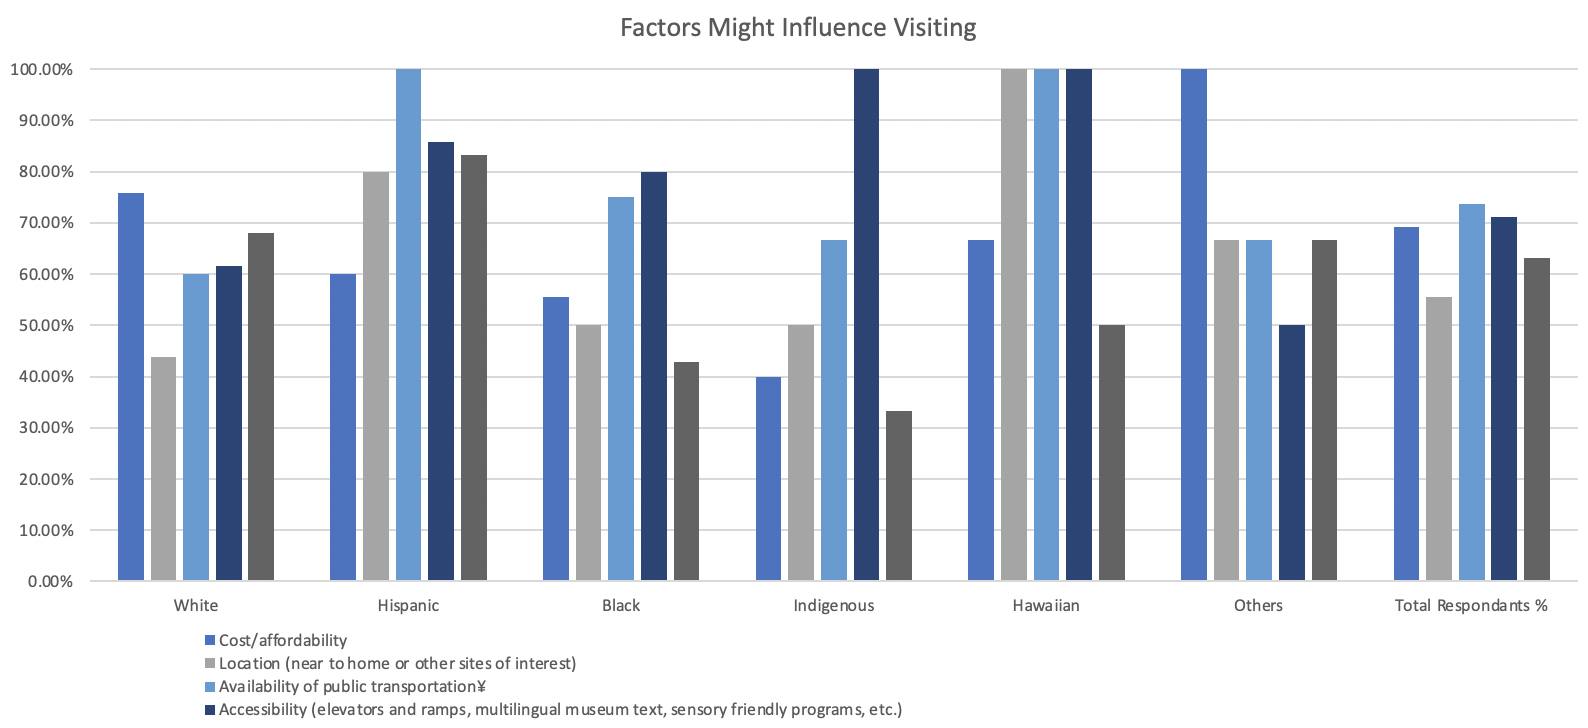
According to this chart, it indicates an overall trend of considering availability of public transportation is the major factor that might influence respondents’ willingness to attend museums. And Hispanic respondents group represents the highest percentage in this factor.
– Factor as Race or Ethnicity :
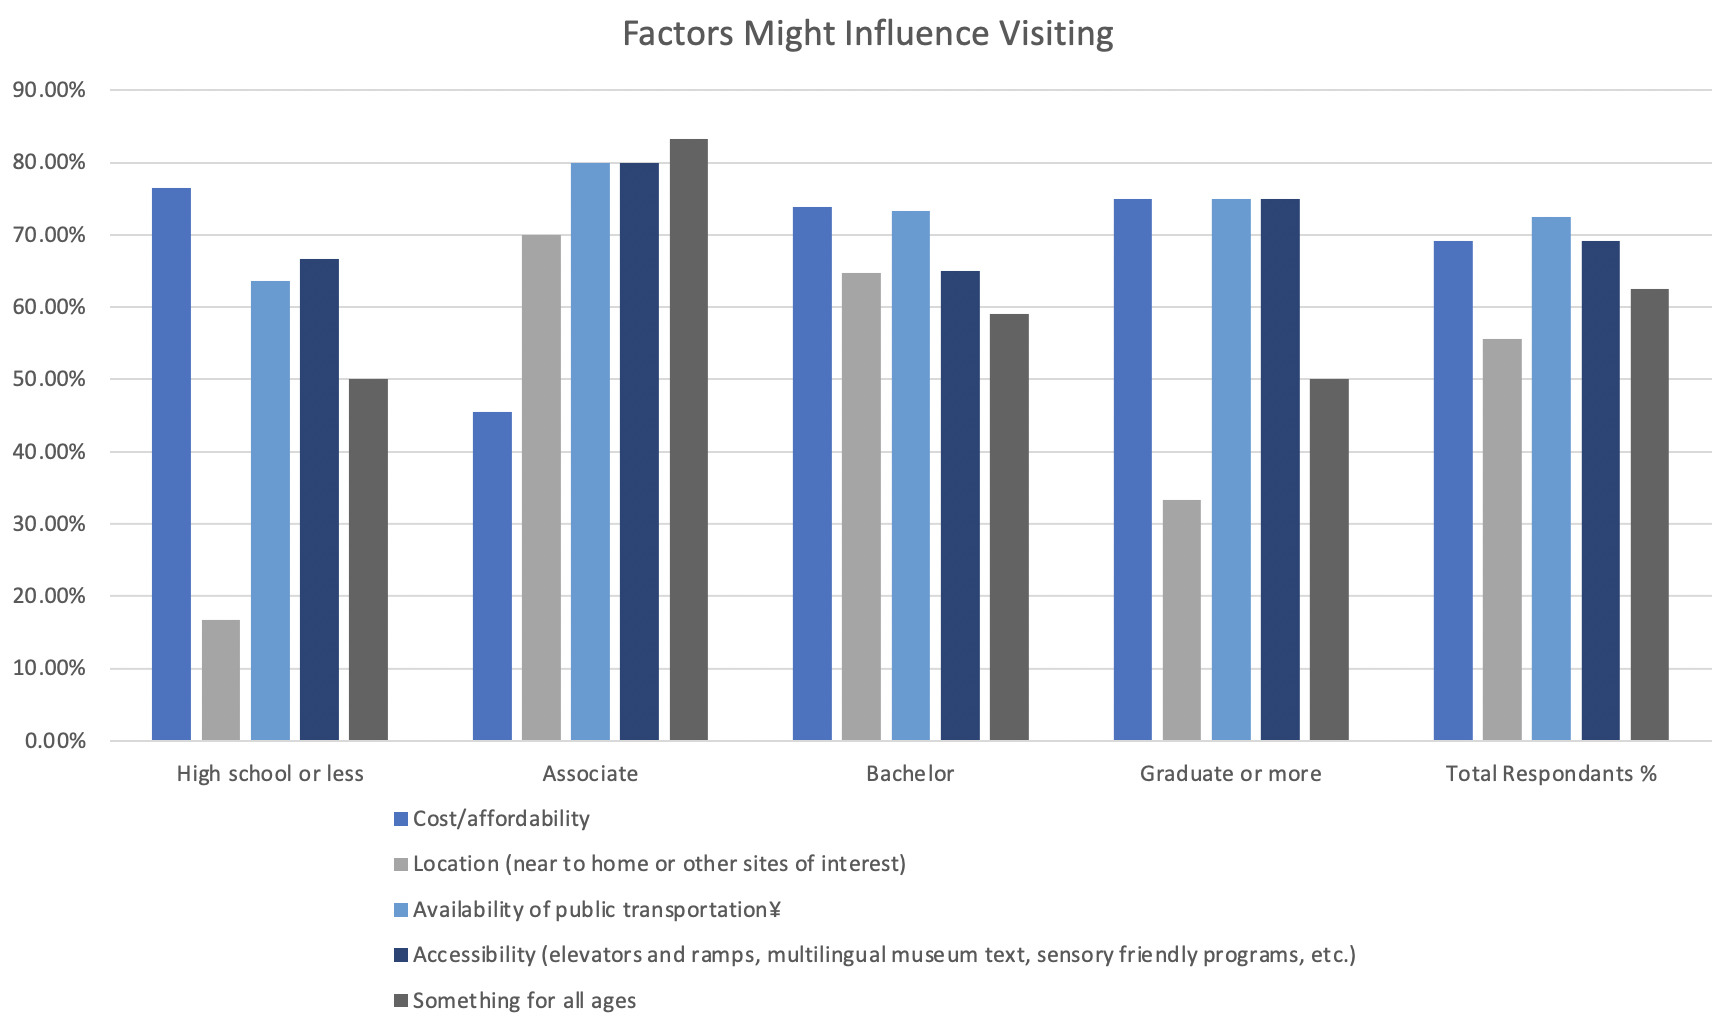
Also in this chart, an overall trend of considering availability of public transportation has shown, with general equal distributed rate. Further, respondents with Associate or Bachelor degree has higher consideration of cite of the institution for their visiting.
-
Prefered Historical Themes and Activities
The data discussed in this section are based on the CHS recommendations to find the theme of the exhibition or event that the audience prefers. To better understand the preferences for types of exhibits and activities intersected with race and education level, the charts are presented in pair shown in below.
- Historic Period Preferences
– Factor as Race or Ethnicity :
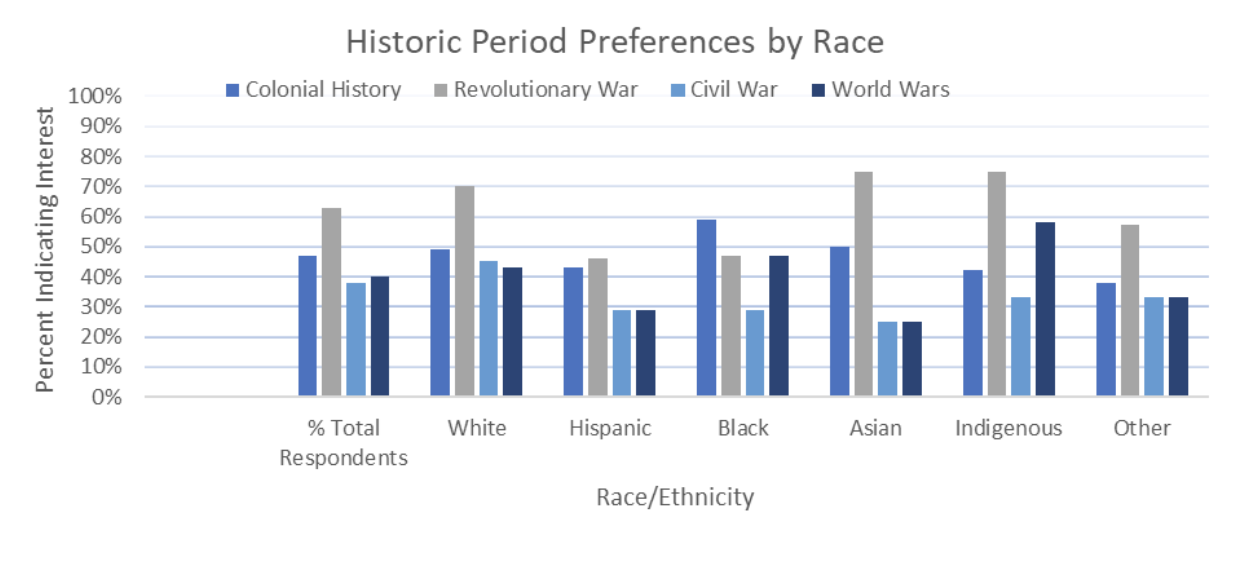
This graph indicates an overall preference for exhibits on the Revolutionary War period, and a preference for that period across all ethnic groups, except for Black respondents, who preferred Colonial History.
– Factor as Education Level :
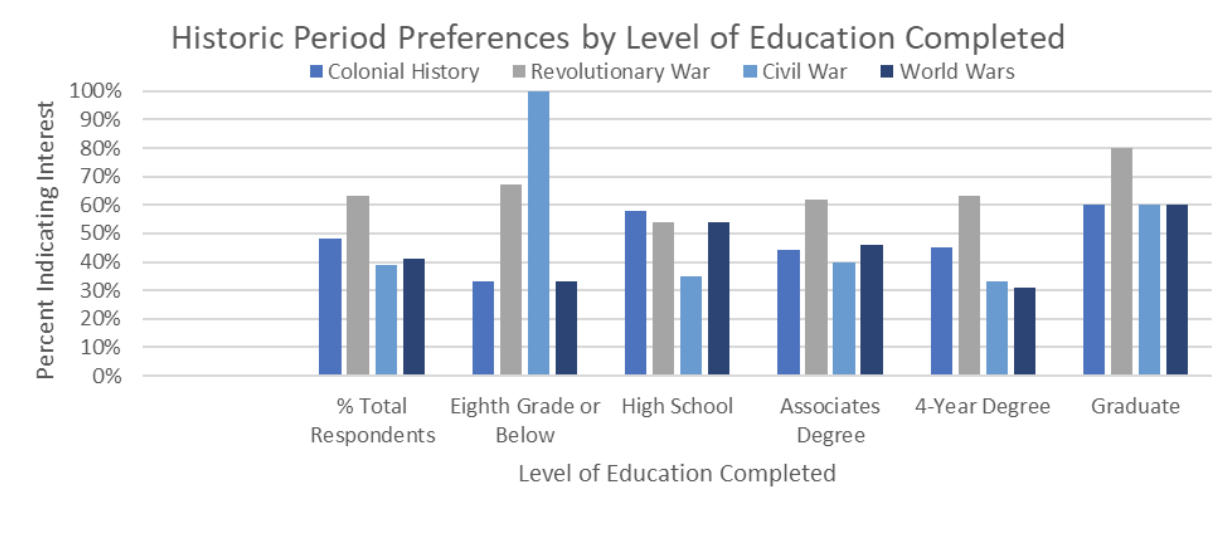
This graph indicates an overall preference for Revolutionary War exhibits; but a higher percentage of those who had completed an eighth grade level of education or less had interest in the Civil War, and a higher percentage of those who had completed high school preferred Colonial history.
-
Connecticut Cultural History Interest
Historical theme include: African American History, AAPI History, Women’s History, Indigenous History, Latinx/ Hispanic History, and Other Cultural History.
– Factor as Education Level:

According to this group of data, it indicates an overall preference of Indigenous history, with highest percentage in the group of respondents with less than high school degree.
– Factor as Race or Ethnicity:
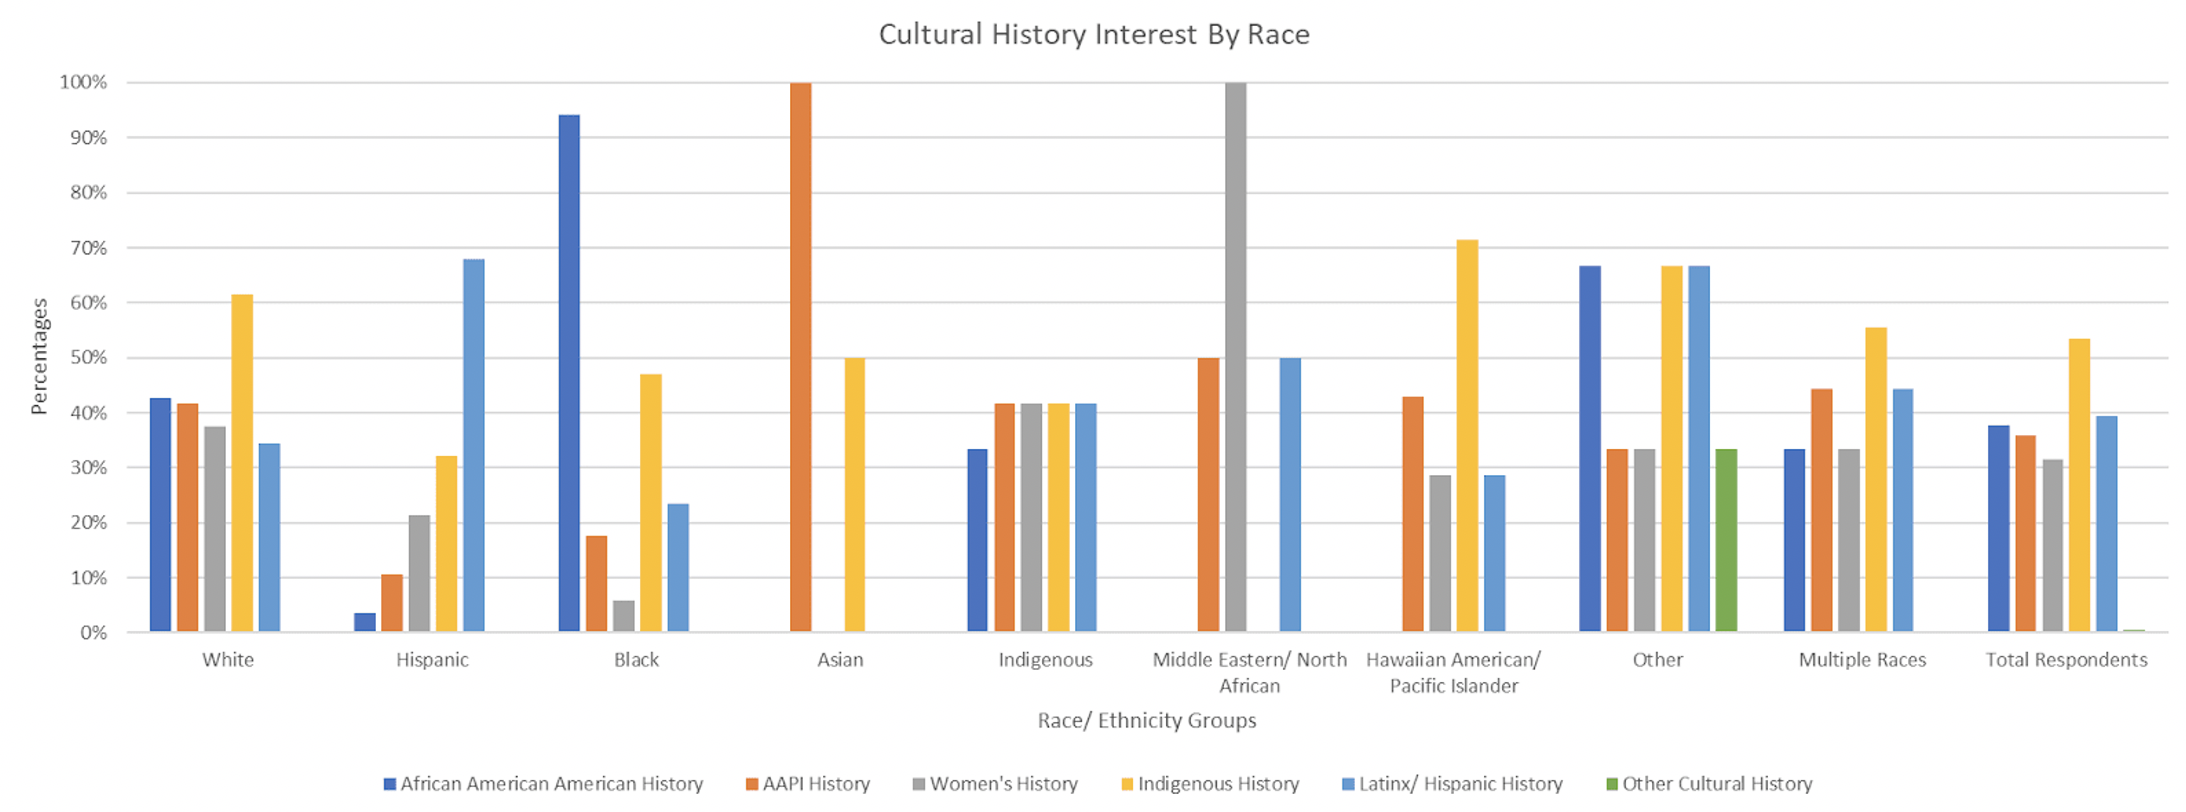
Similar to the data shown above, the overall preference of indigenous history are suggested. However, each ethnicity group in this data shows their interest in own culture with the highest percentage compared to other group.
-
Interest In Other Connecticut Historical Themes Preferences:
Historical themes include: Religious History, Hartford History, Political History, and Urban/Industrial Development History.
– Factor as Education:
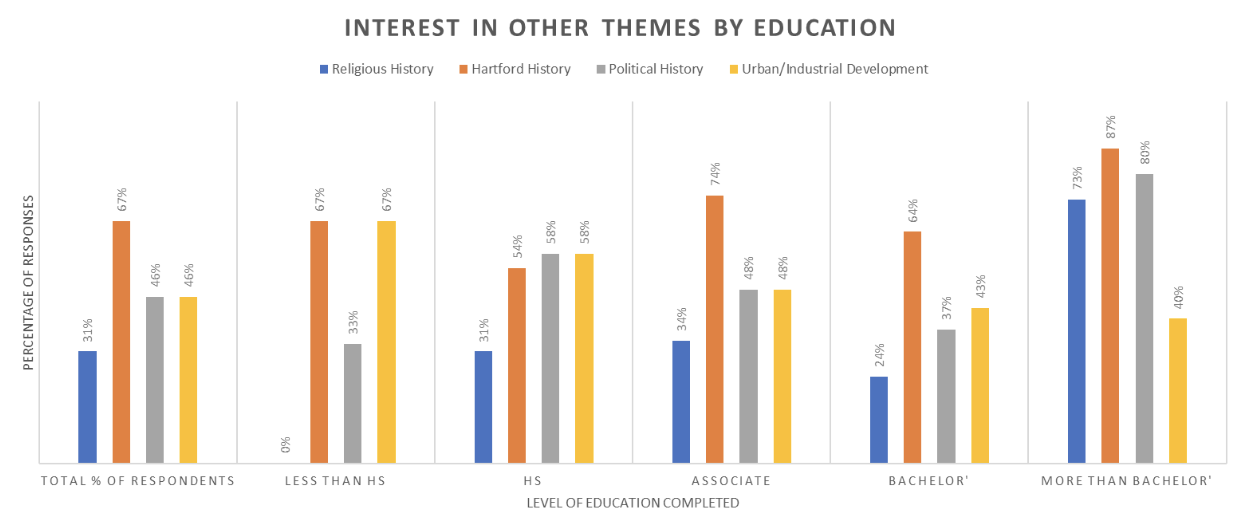
In this sample, all groups except more than a bachelor’ degree showed low interest in Religious History.
– Factor as Race or Ethnicity:
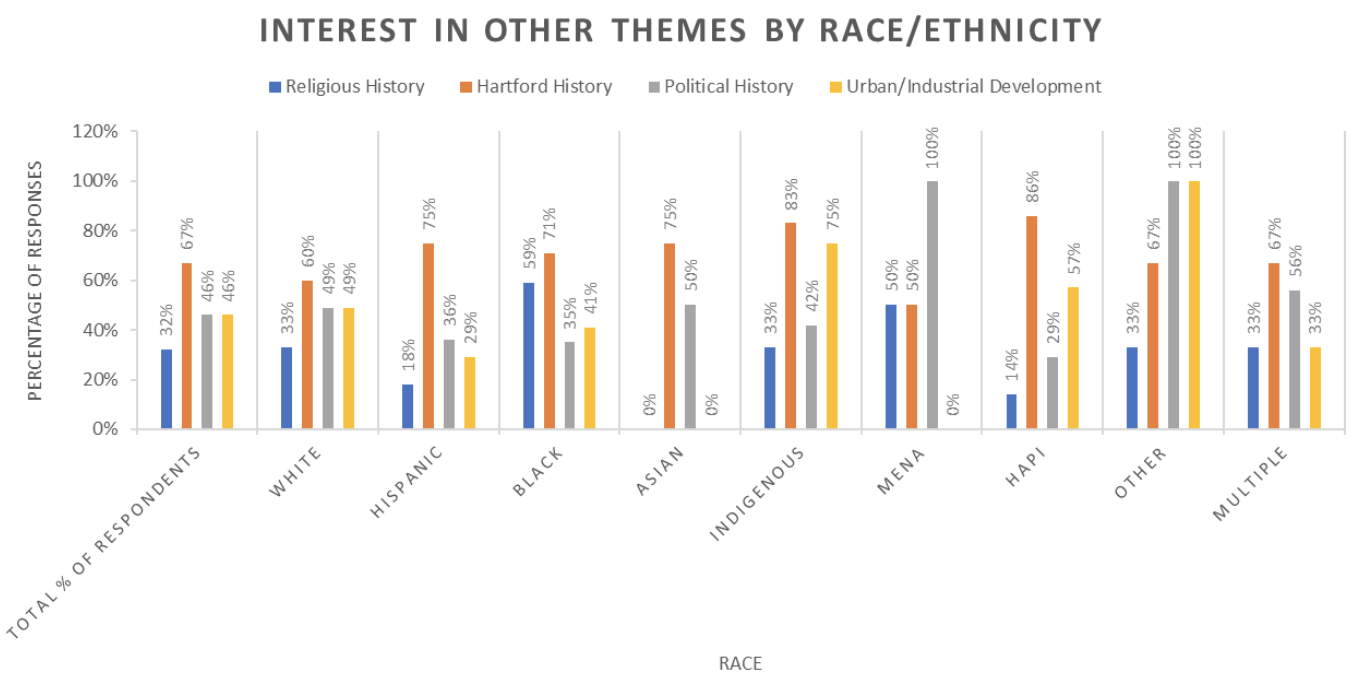
The data indicates that for the category of “other themes,” all races and ethnicities were most interested in Hartford History.
- Potential Activity at Connecticut Historical Society Interest:
Potential Activities include:
-
- a historically-themed party with food, drink and dancing
- a moderated conversation about a topic with that’s relevant to the news today
- a class or demonstration on cooking foods from other cultures
- a traditional exhibit with a curated collection of museum objects and images
- a highly interactive exhibition using up-to-date technology
- an exhibition that takes a lighthearted look at history and culture
- a workshop on how to research your family’s history/genealogy
– Factor as Education Attainment:
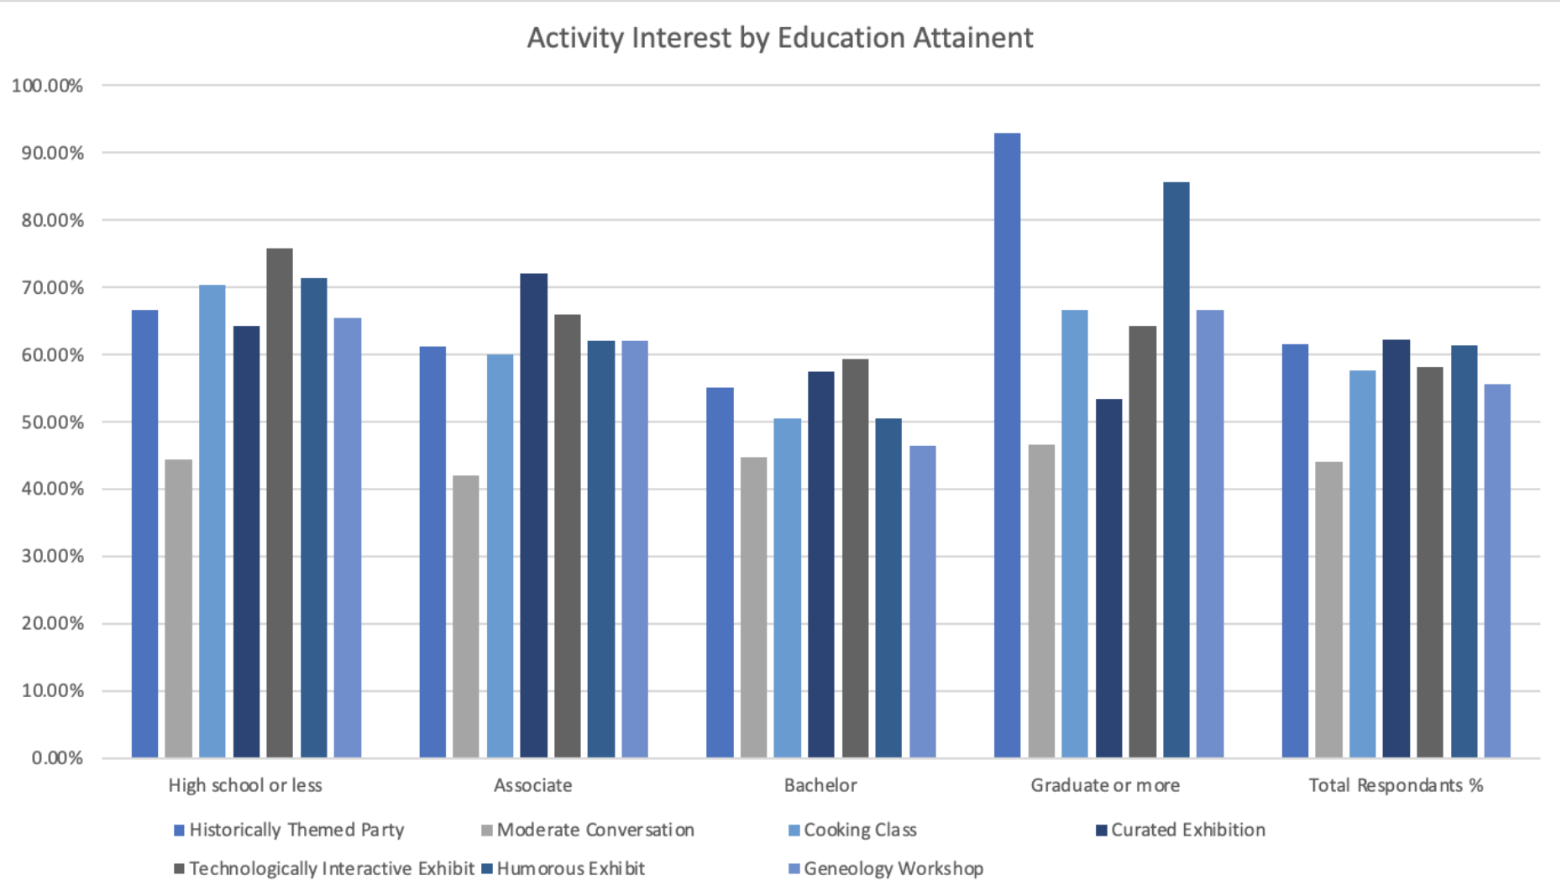
This graph suggests a overall preferences on the activities as Historical Themed party, Traditional Exhibit with Curated Collection, and a Lighthearted Look on History and Culture. Especially, respondents with the degree of graduate or more has higher interest in these topics. However, lower percentage of preference in a Moderate Conversation of Current Event indicated in this group.
– Factor as Race or Ethnicity :
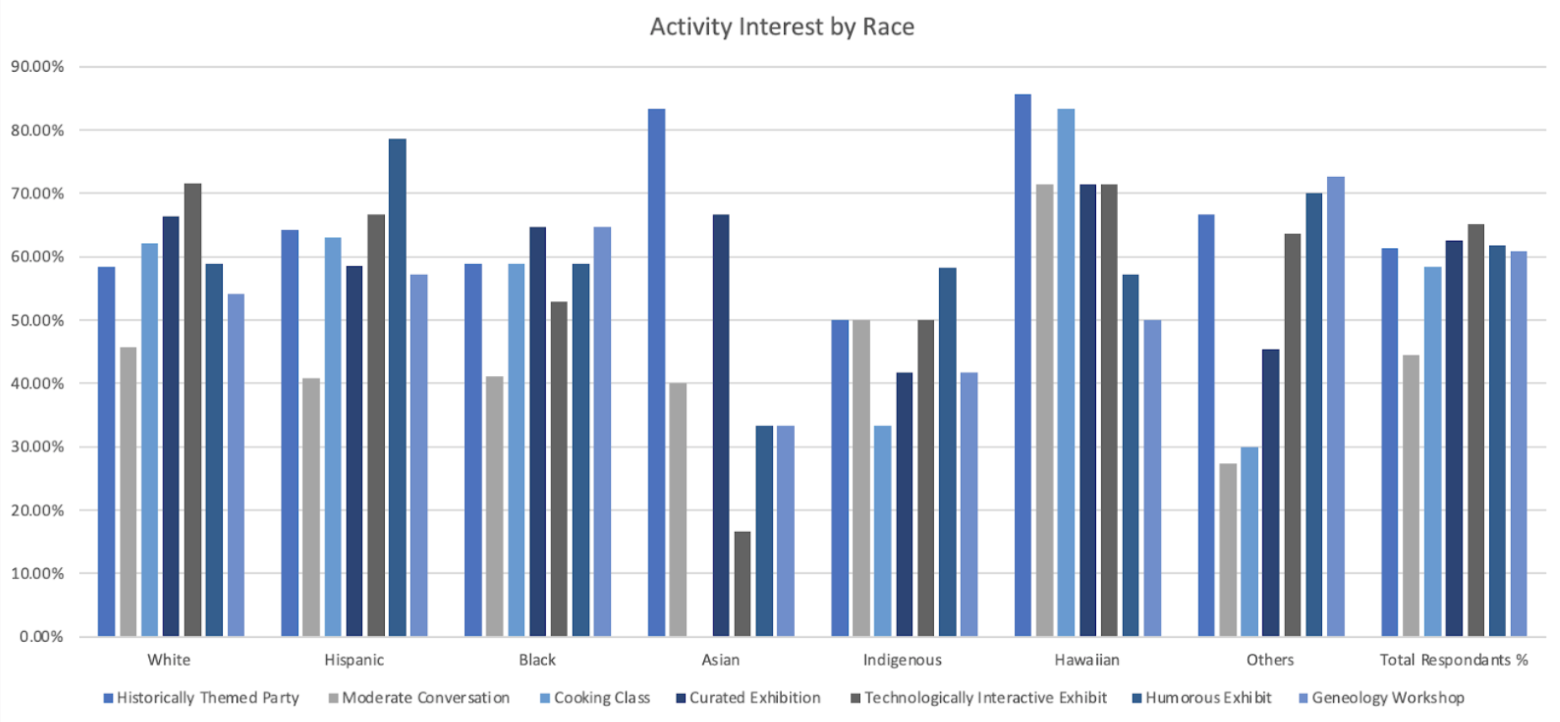
This graph indicates an overall preference for Technologically Interactive Exhibition. But a higher percentage of Asian and Hawaiian respondents had interest in the Historically Themed Party. Similar trend of lower interest in Moderate Conversation of Current Event also is indicated in this ethnicity group.
- Possible Historically-themed event if it’s holden on campus
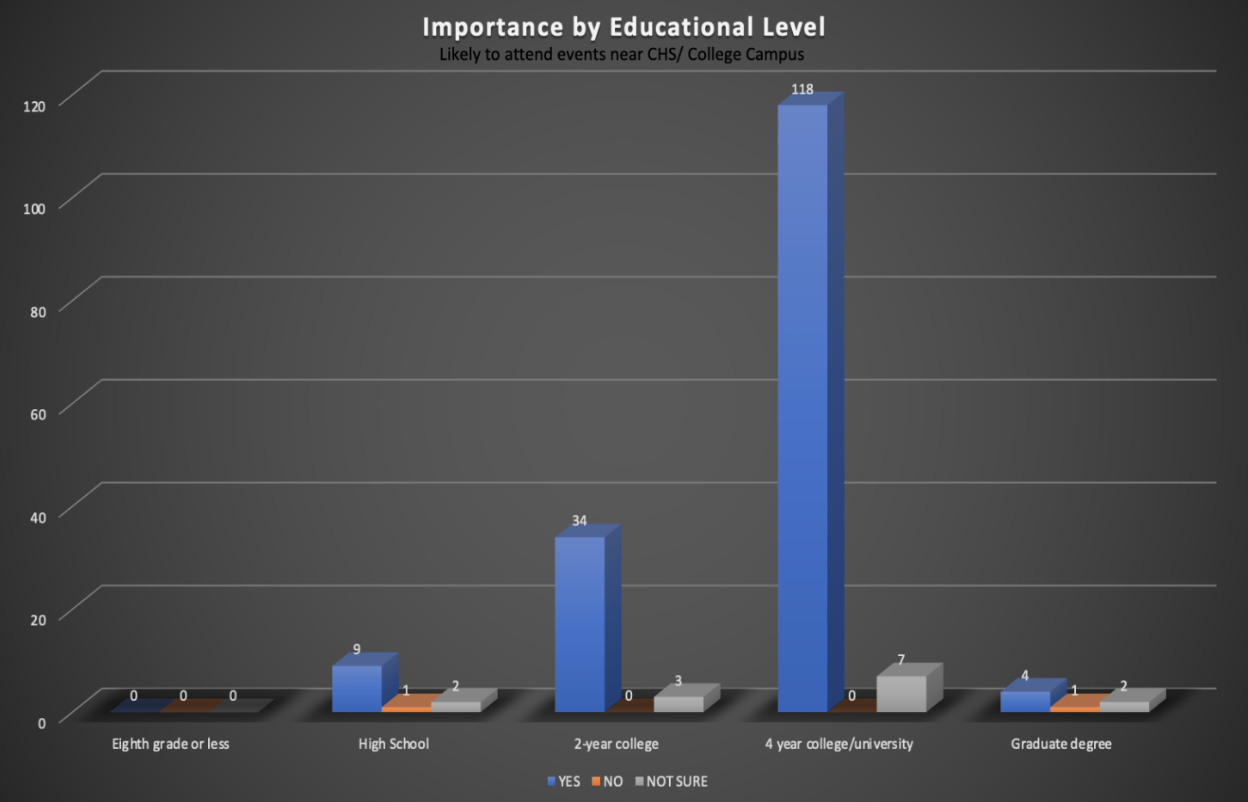
As shown above, high percentage of willingness attended the activity held on campus is indicated in this graph. And respondents with bachelor degree have highest preference in this option.
